Edit chart
Loading graph
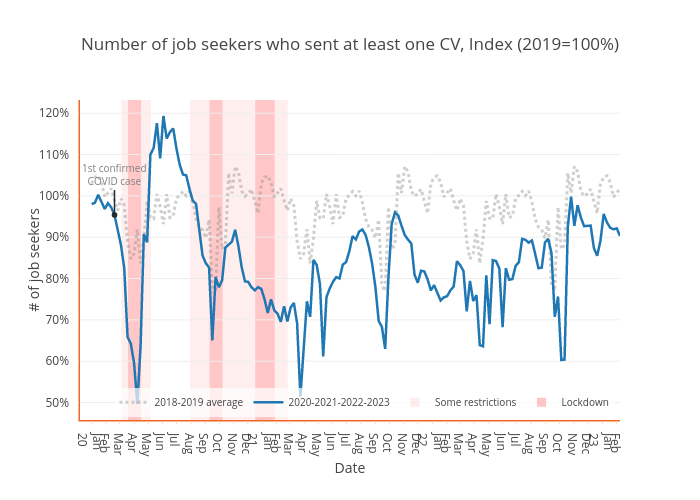
Tslilaloni's interactive graph and data of "Number of job seekers who sent at least one CV, Index (2019=100%)" is a scatter chart, showing 2018-2019 average, 2020-2021-2022-2023, Some restrictions, Lockdown; with Date in the x-axis and # of job seekers in the y-axis.. The x-axis shows values from 0 to 0. The y-axis shows values from 0 to 0. This visualization has the following annotation: 1st confirmedCOVID case