Edit chart
Loading graph
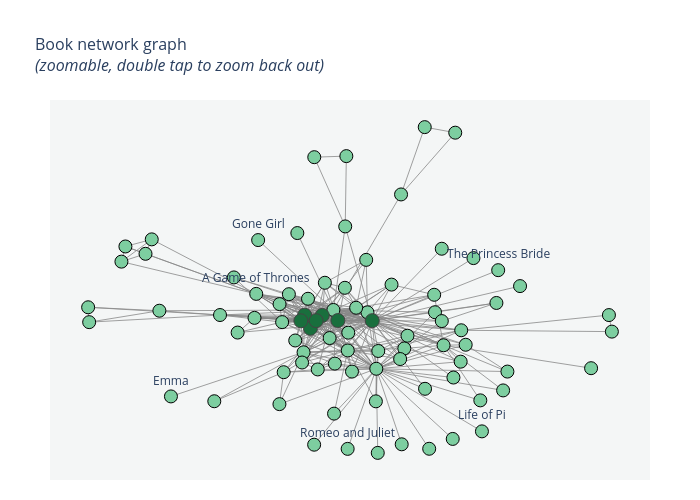
Tri.qu.nguyen's interactive graph and data of "Book network graph (zoomable, double tap to zoom back out)" is a line chart, showing vs . The x-axis shows values from 0 to 0. The y-axis shows values from 0 to 0. This visualization has the following annotations: Romeo and Juliet; Gone Girl; A Game of Thrones; Life of Pi; The Princess Bride; Emma