Edit chart
Loading graph
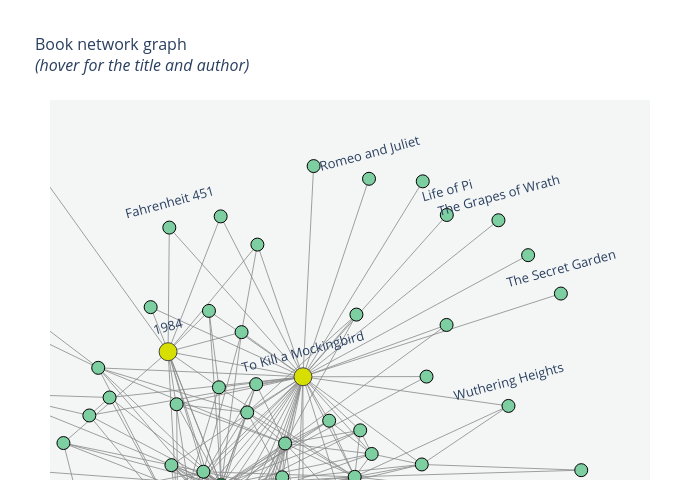
Tri.qu.nguyen's interactive graph and data of "Book network graph (hover for the title and author)" is a line chart, showing , , . The x-axis shows values from -0.3 to 0.75. The y-axis shows values from 0.003 to 0.9. This visualization has the following annotations: To Kill a Mockingbird; 1984; Romeo and Juliet; Life of Pi; Fahrenheit 451; Wuthering Heights; The Secret Garden; The Grapes of Wrath