Edit chart
Loading graph
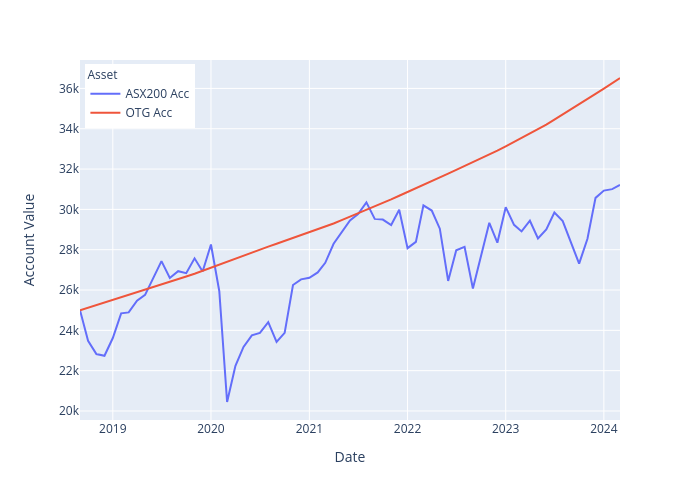
Trent0099's interactive graph and data of "Account Value vs Date" is a line chart, showing ASX200 Acc vs OTG Acc; with Date in the x-axis and Account Value in the y-axis.. The x-axis shows values from 0 to 0. The y-axis shows values from 0 to 0.