Edit chart
Loading graph
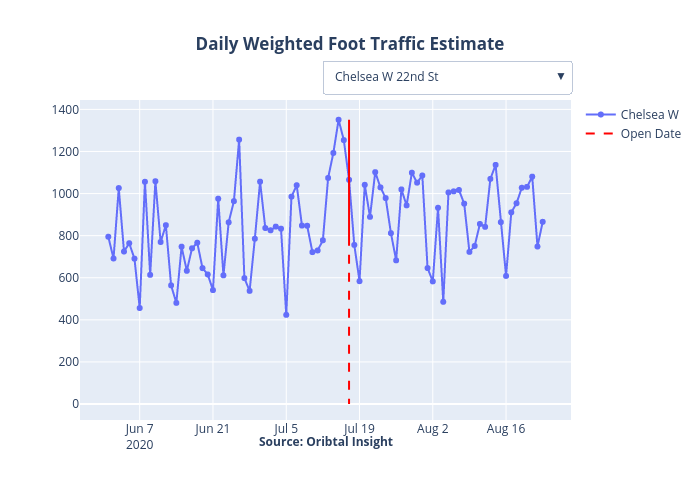
Trd_data's interactive graph and data of "Daily Weighted Foot Traffic Estimate" is a line chart, showing Chelsea W vs Open Date. The x-axis shows values from 0 to 0. The y-axis shows values from 0 to 0. This visualization has the following annotation: Source: Oribtal Insight