Edit chart
Loading graph
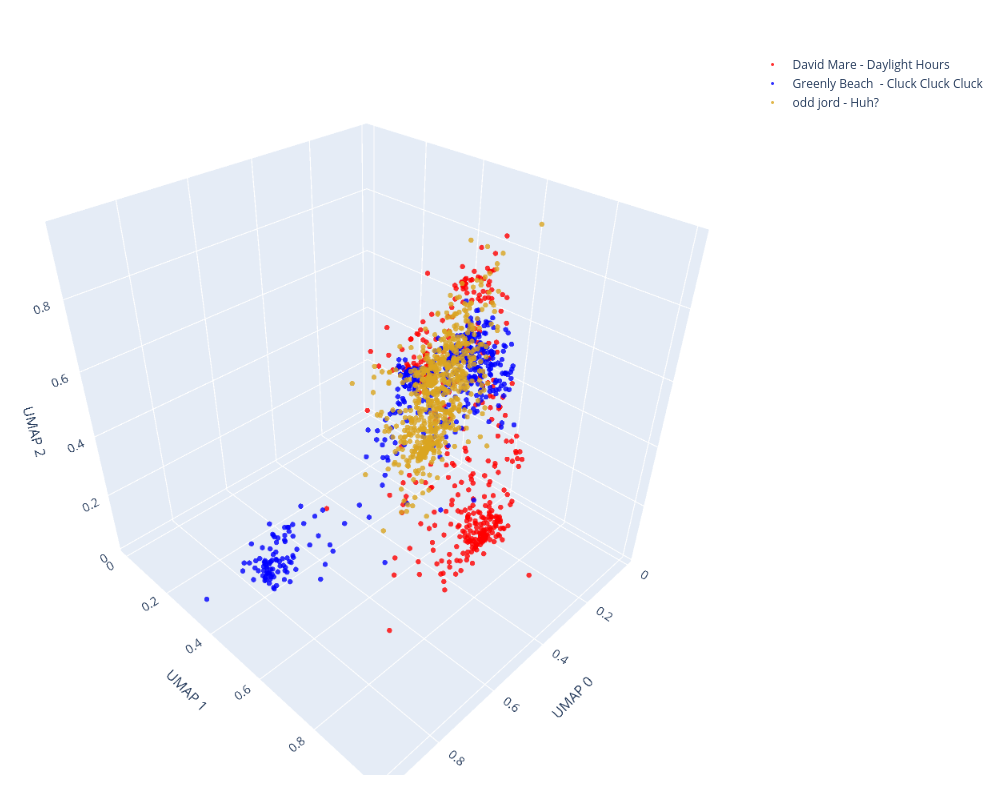
Tomschaap's interactive graph and data of "David Mare - Daylight Hours, Greenly Beach - Cluck Cluck Cluck, odd jord - Huh?" is a scatter3d, showing David Mare - Daylight Hours, Greenly Beach - Cluck Cluck Cluck, odd jord - Huh?. The x-axis shows values from 0 to 0. The y-axis shows values from 0 to 0.