Edit chart
Loading graph
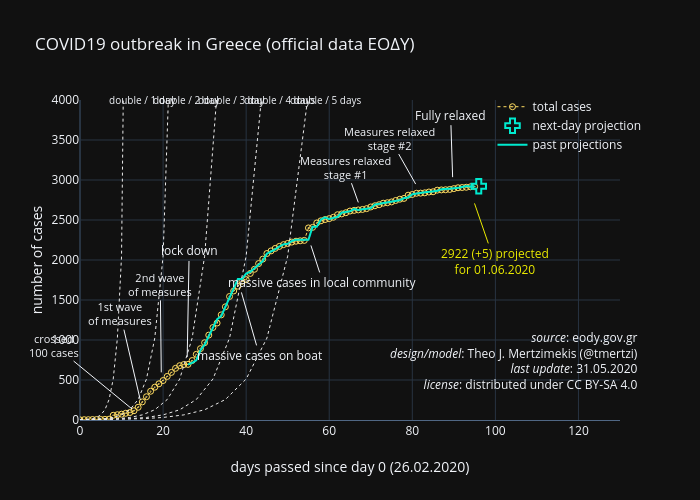
Tmertzi's interactive graph and data of "COVID19 outbreak in Greece (official data ΕΟΔΥ)" is a , showing total cases, next-day projection, past projections, double every 1 day, double every 2 days, double every 3 days, double every 4 days, double every 5 days; with days passed since day 0 (26.02.2020) in the x-axis and number of cases in the y-axis.. The x-axis shows values from 0 to 130. The y-axis shows values from 0 to 4000. This visualization has the following annotations: crossed100 cases; 1st waveof measures; 2nd waveof measures; lock down; 2922 (+5) projectedfor 01.06.2020; source: eody.gov.grdesign/model: Theo J. Mertzimekis (@tmertzi) last update: 31.05.2020 license: distributed under CC BY-SA 4.0; double / 1 day; double / 2 day; double / 3 day; double / 4 days; double / 5 days; Measures relaxedstage #1; Measures relaxedstage #2; massive cases on boat; massive cases in local community; Fully relaxed