Edit chart
Loading graph
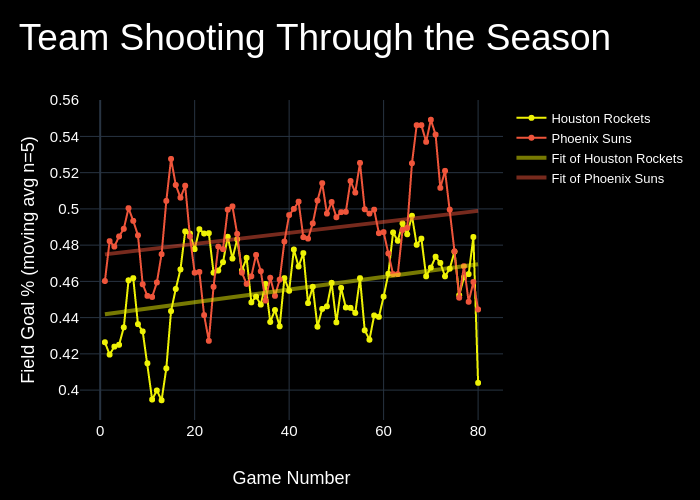
Thechopshop's interactive graph and data of "Team Shooting Through the Season" is a , showing Houston Rockets vs Phoenix Suns; with Game Number in the x-axis and Field Goal % (moving avg n=5) in the y-axis.. The x-axis shows values from -4.078098827470686 to 85.07809882747068. The y-axis shows values from 0.3841397683397683 to 0.5594602316602317.