Edit chart
Loading graph
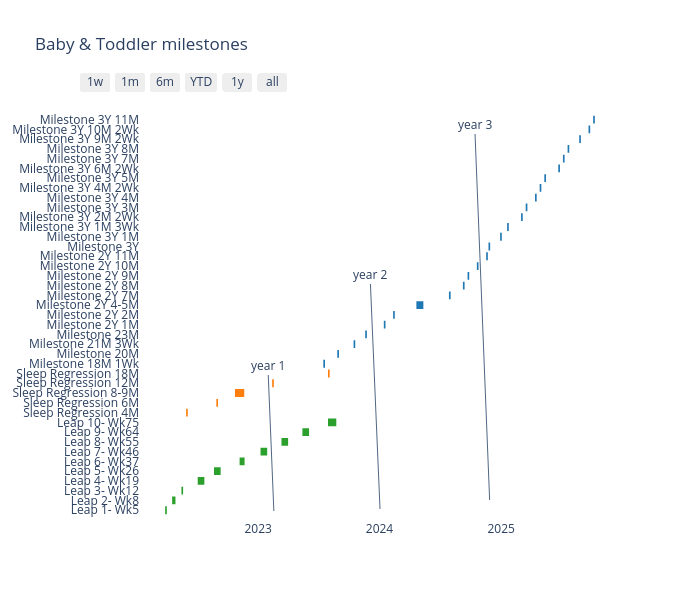
Thebabydatascientist's interactive graph and data of "Baby & Toddler milestones" is a filled , showing Sleep regression, Milestones, Wonder weeks, , , ; with time in the x-axis. The x-axis shows values from 2022-01-10 06:44:06.6865 to 2025-12-24 17:15:53.3135. The y-axis shows values from -1 to 42. This visualization has the following annotations: year 1; year 2; year 3