Edit chart
Loading graph
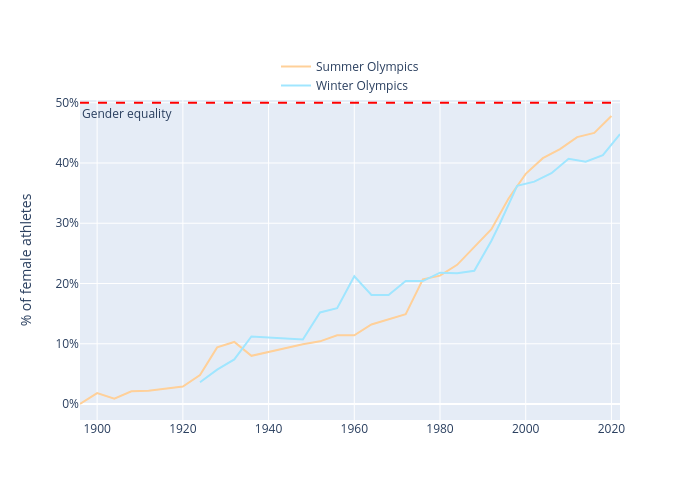
Thbraet's interactive graph and data of "Summer Olympics vs Winter Olympics" is a scatter chart, showing Summer Olympics vs Winter Olympics; with % of female athletes in the y-axis. The x-axis shows values from 0 to 0. The y-axis shows values from 0 to 0. This visualization has the following annotation: Gender equality