Edit chart
Loading graph
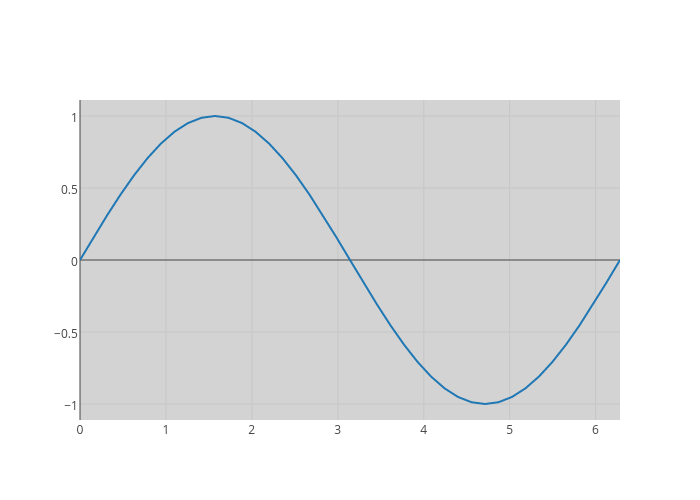
Tarzzz's interactive graph and data of "y" is a scatter chart, showing y. The x-axis shows values from 0 to 6.28318530717959. The y-axis shows values from -1.1111111111111112 to 1.1111111111111112.