Edit chart
Loading graph
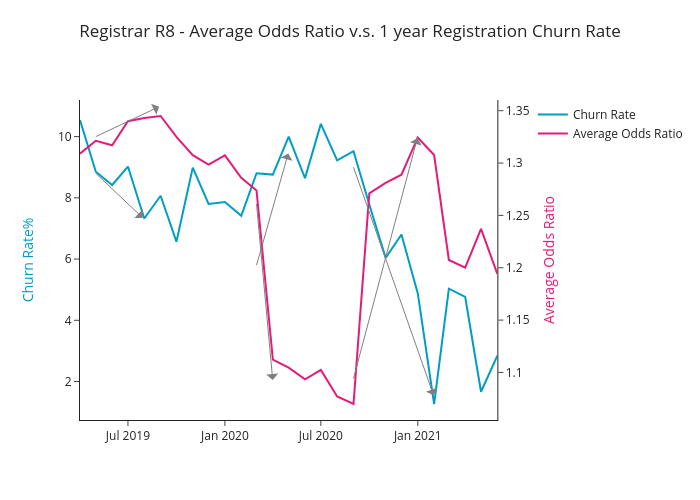
Takkyi83's interactive graph and data of "Registrar R8 - Average Odds Ratio v.s. 1 year Registration Churn Rate" is a line chart, showing Churn Rate vs Average Odds Ratio; with Churn Rate% in the y-axis. The x-axis shows values from 0 to 0. The y-axis shows values from 0 to 0.