Edit chart
Loading graph
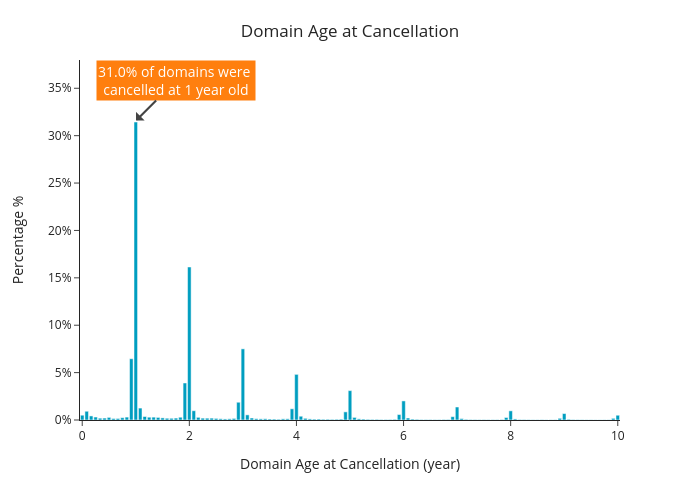
Takkyi83's interactive graph and data of "Domain Age at Cancellation" is a bar chart; with Domain Age at Cancellation (year) in the x-axis and Percentage % in the y-axis.. The x-axis shows values from 0 to 0. The y-axis shows values from 0 to 0. This visualization has the following annotation: 31.0% of domains were cancelled at 1 year old