Edit chart
Loading graph
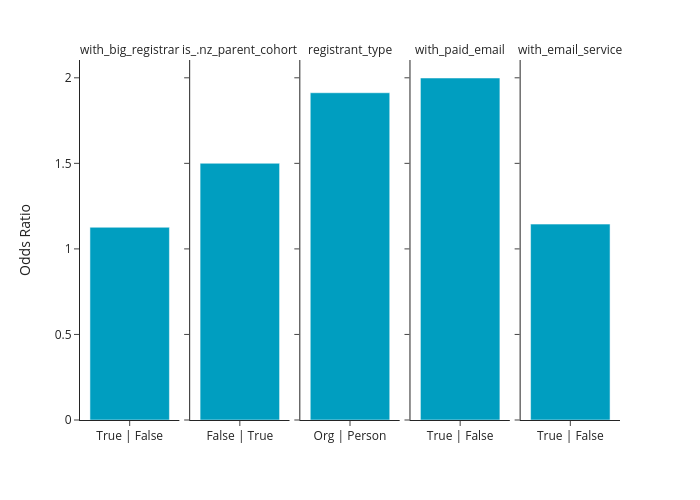
Takkyi83's interactive graph and data of "True | False, True | False, True | False, False | True, Org | Person" is a , showing True | False, True | False, True | False, False | True, Org | Person; with Odds Ratio in the y-axis. The x-axis shows values from 0 to 0. The y-axis shows values from 0 to 0. This visualization has the following annotations: with_big_registrar; is_.nz_parent_cohort; registrant_type; with_paid_email; with_email_service