Edit chart
Loading graph
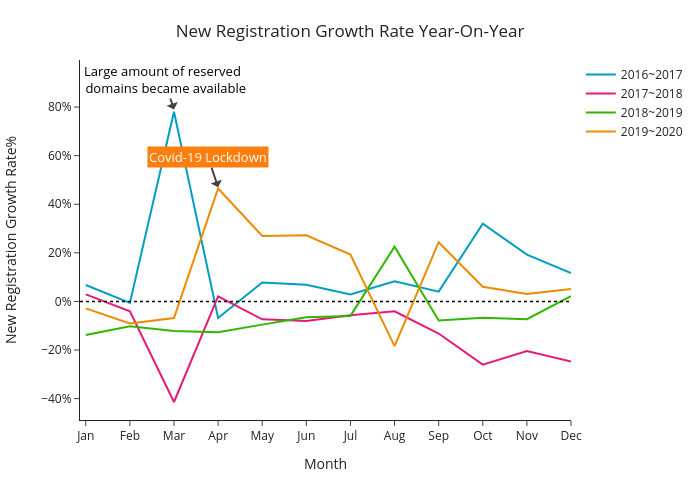
Takkyi83's interactive graph and data of "New Registration Growth Rate Year-On-Year" is a line chart, showing 2016~2017, 2017~2018, 2018~2019, 2019~2020; with Month in the x-axis and New Registration Growth Rate% in the y-axis.. The x-axis shows values from 0 to 0. The y-axis shows values from 0 to 0. This visualization has the following annotations: Covid-19 Lockdown; Large amount of reserved domains became available