Edit chart
Loading graph
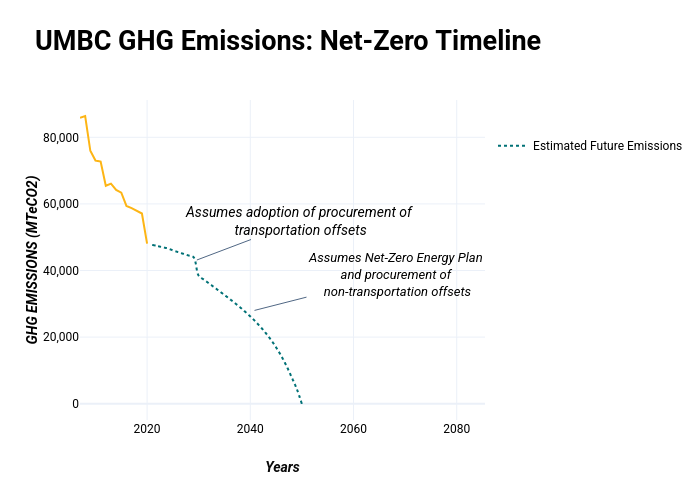
Sustainableumbc's interactive graph and data of "UMBC GHG Emissions: Net-Zero Timeline" is a line chart, showing ; with Years in the x-axis and GHG EMISSIONS (MTeCO2) in the y-axis.. The x-axis shows values from 2007 to 2050. The y-axis shows values from -4901.166666666667 to 91202.16666666667. This visualization has the following annotations: Assumes adoption of procurement of transportation offsets; Assumes Net-Zero Energy Planand procurement of non-transportation offsets