Edit chart
Loading graph
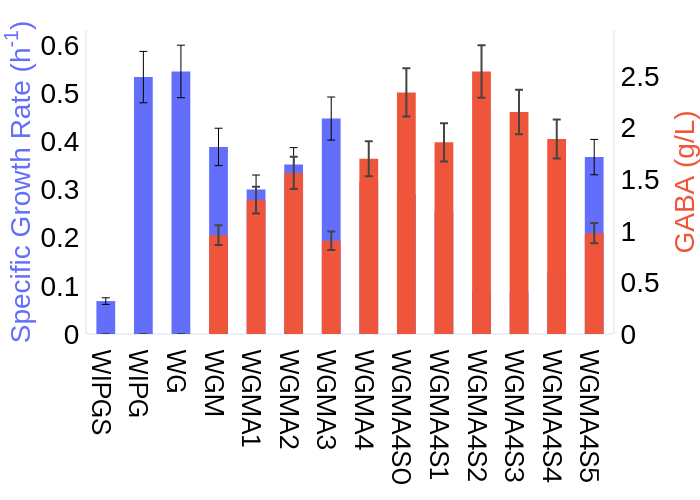
Sunbeck's interactive graph and data of "" is a grouped bar chartwith vertical error bars; with in the x-axis and Specific Growth Rate (h-1) in the y-axis.. The x-axis shows values from -0.5 to 13.5. The y-axis shows values from 0 to 0.6310526315789473.