Edit chart
Loading graph
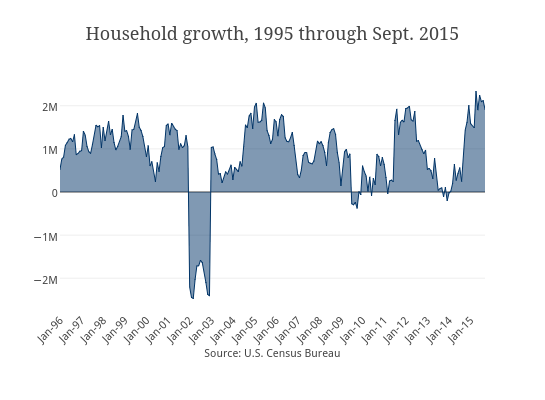
Stacyannj's interactive graph and data of "Household growth, 1995 through Sept. 2015" is a filled line chart, showing Col3; with Source: U.S. Census Bureau in the x-axis. The x-axis shows values from 0 to 236. The y-axis shows values from -2736700 to 2597300.