Edit chart
Loading graph
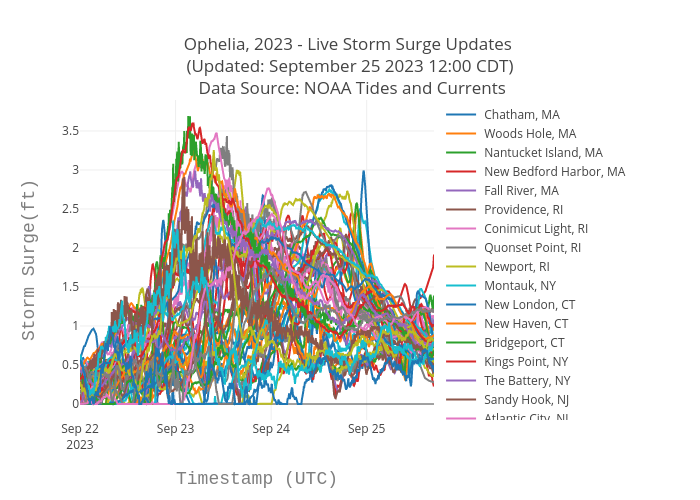
Srcc2020's interactive graph and data of "Ophelia, 2023 - Live Storm Surge Updates (Updated: September 25 2023 12:00 CDT) Data Source: NOAA Tides and Currents" is a scatter chart, showing Chatham, MA, Woods Hole, MA, Nantucket Island, MA, New Bedford Harbor, MA, Fall River, MA, Providence, RI, Conimicut Light, RI, Quonset Point, RI, Newport, RI, Montauk, NY, New London, CT, New Haven, CT, Bridgeport, CT, Kings Point, NY, The Battery, NY, Sandy Hook, NJ, Atlantic City, NJ, Cape May, NJ, Ship John Shoal, NJ, Burlington,Delaware River,NJ, Newbold, PA, Bridesburg, PA, Philadelphia, PA, Marcus Hook, PA, Delaware City, DE, Reedy Point, DE, Brandywine Shoal Light, DE, Lewes, DE, Chesapeake City, MD, Baltimore, MD, Tolchester Beach, MD, Annapolis, MD, Cambridge, MD, Ocean City Inlet, MD, Solomons Island, MD, Bishops Head, MD, Wachapreague, VA, Washington, DC, Dahlgren, VA, Lewisetta, VA, Windmill Point, VA, Yorktown USCG Training Center, VA, CBBT,Chesapeake Channel,VA, Sewells Point, VA, Kiptopeke, VA, Duck, NC, Oregon Inlet Marina, NC, USCG Station Hatteras, NC, Beaufort,Duke Marine Lab,NC, Wrightsville Beach, NC, Springmaid Pier, SC; with Timestamp (UTC) in the x-axis and Storm Surge(ft) in the y-axis.. The x-axis shows values from 0 to 0. The y-axis shows values from 0 to 0.