Edit chart
Loading graph
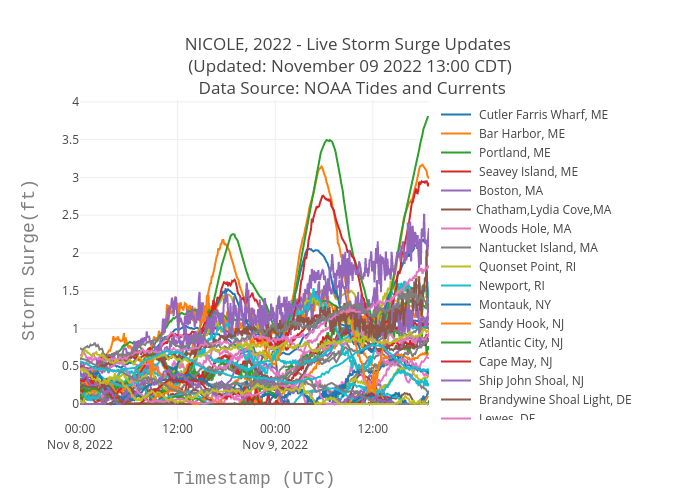
Srcc2020's interactive graph and data of "NICOLE, 2022 - Live Storm Surge Updates (Updated: November 15 2022 12:00 CDT) Data Source: NOAA Tides and Currents" is a scatter chart, showing Cutler Farris Wharf, ME, Bar Harbor, ME, Portland, ME, Seavey Island, ME, Boston, MA, Chatham,Lydia Cove,MA, Woods Hole, MA, Nantucket Island, MA, Quonset Point, RI, Newport, RI, Montauk, NY, Sandy Hook, NJ, Atlantic City, NJ, Cape May, NJ, Ship John Shoal, NJ, Brandywine Shoal Light, DE, Lewes, DE, Ocean City Inlet, MD, Wachapreague, VA, Windmill Point, VA, Yorktown USCG Training Center, VA, CBBT, Chesapeake Channel,VA, Sewells Point, VA, Kiptopeke, VA, Duck, NC, Oregon Inlet Marina, NC, USCG Station Hatteras, NC, Beaufort,Duke Marine Lab,NC, Wrightsville Beach, NC, Springmaid Pier, SC, Charleston,Cooper River Entrance,SC, Fort Pulaski, GA, Fernandina Beach, FL, Mayport (Bar Pilots Dock), FL, Trident Pier,Port Canaveral,FL, Lake Worth Pier,Atlantic Ocean,FL, South Port Everglades, FL, Virginia Key,Biscayne Bay,FL, Key West, FL, Fort Myers, FL, Port Manatee, FL, East Bay, FL, Old Port Tampa, FL, St. Petersburg,Tampa Bay,FL, Clearwater Beach, FL, Cedar Key, FL, Apalachicola, FL, Panama City, FL, Panama City Beach, FL, Pensacola, FL; with Timestamp (UTC) in the x-axis and Storm Surge(ft) in the y-axis.. The x-axis shows values from 0 to 0. The y-axis shows values from 0 to 0.