Edit chart
Loading graph
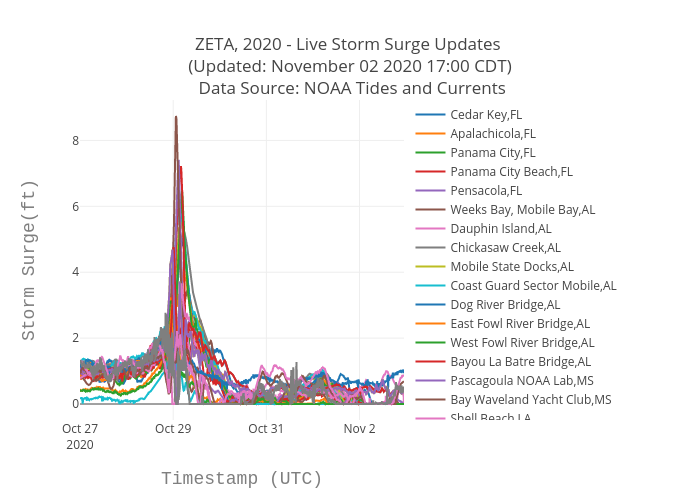
Srcc2020's interactive graph and data of "ZETA, 2020 - Live Storm Surge Updates (Updated: November 02 2020 17:00 CDT) Data Source: NOAA Tides and Currents" is a scatter chart, showing Cedar Key,FL, Apalachicola,FL, Panama City,FL, Panama City Beach,FL, Pensacola,FL, Weeks Bay, Mobile Bay,AL, Dauphin Island,AL, Chickasaw Creek,AL, Mobile State Docks,AL, Coast Guard Sector Mobile,AL, Dog River Bridge,AL, East Fowl River Bridge,AL, West Fowl River Bridge,AL, Bayou La Batre Bridge,AL, Pascagoula NOAA Lab,MS, Bay Waveland Yacht Club,MS, Shell Beach,LA, New Canal Station,LA, I-10 Bonnet Carre Floodway,LA, Pilottown,LA, Pilots Station East, S.W. Pass,LA, Grand Isle,LA, Port Fourchon, Belle Pass,LA, New Canal Station,LA, I-10 Bonnet Carre Floodway,LA, LAWMA, Amerada Pass,LA, Eugene Island, North of Gulf of Mexico,LA, Freshwater Canal Locks,LA; with Timestamp (UTC) in the x-axis and Storm Surge(ft) in the y-axis.. The x-axis shows values from 0 to 0. The y-axis shows values from 0 to 0.