Edit chart
Loading graph
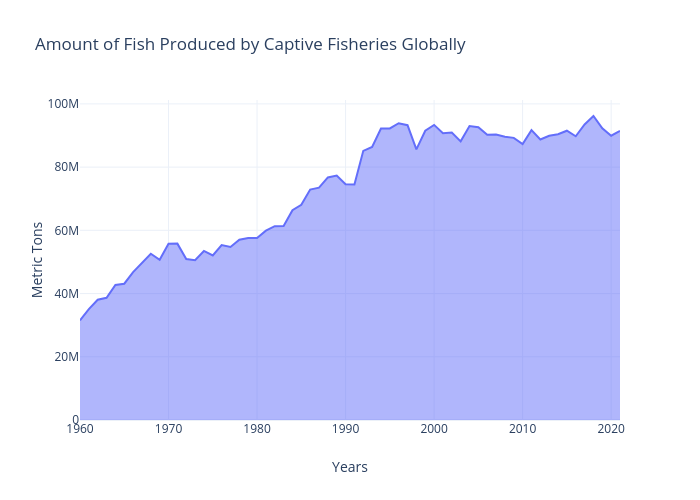
Sophiew24's interactive graph and data of "Amount of Fish Produced by Captive Fisheries Globally" is a line chart; with Years in the x-axis and Metric Tons in the y-axis.. The x-axis shows values from 1960 to 2021. The y-axis shows values from 0 to 101228211.36842105.