Edit chart
Loading graph
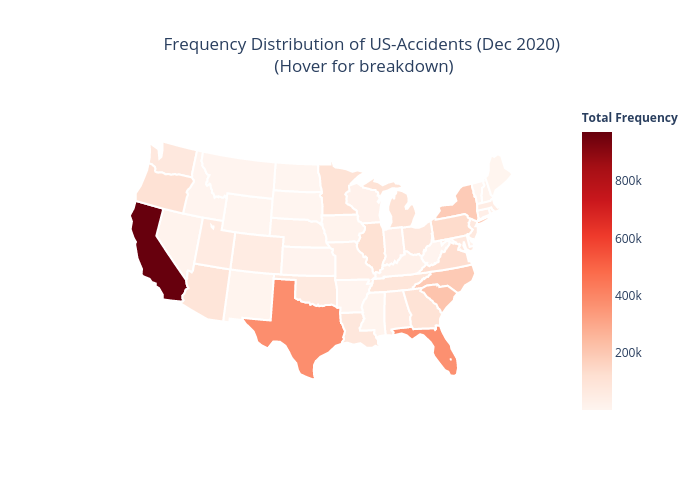
Sobhan.mehr84's interactive graph and data of "Frequency Distribution of US-Accidents (Dec 2020) (Hover for breakdown)" is a choropleth. The x-axis shows values from 0 to 0. The y-axis shows values from 0 to 0.