Edit chart
Loading graph
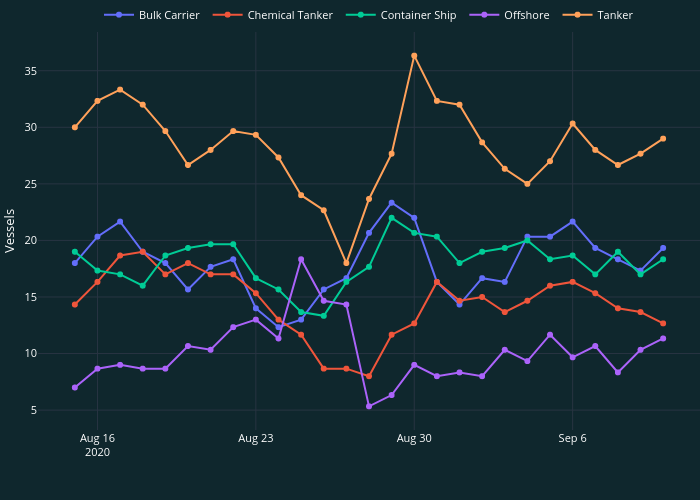
Simao.oliveira's interactive graph and data of "" is a line chart, showing Bulk Carrier , Chemical Tanker , Container Ship , Offshore , Tanker; with in the x-axis and Vessels in the y-axis.. The x-axis shows values from 2020-08-13 10:52:11.3246 to 2020-09-11 13:07:48.6754. The y-axis shows values from 3.314380886744773 to 38.35228577992189.