Edit chart
Loading graph
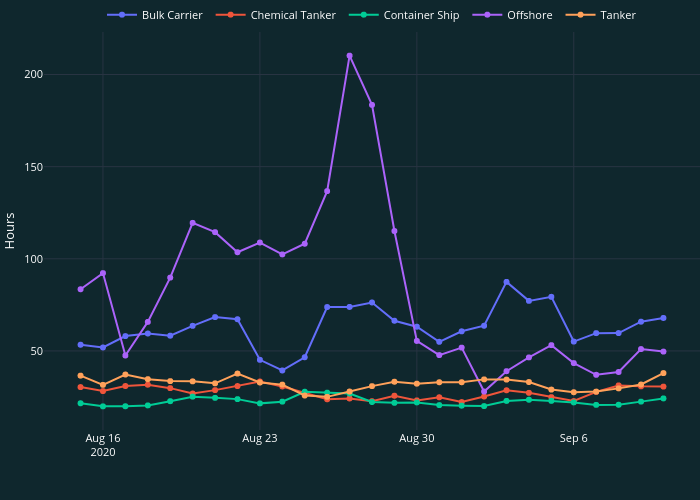
Simao.oliveira's interactive graph and data of "" is a line chart, showing Bulk Carrier , Chemical Tanker , Container Ship , Offshore , Tanker; with in the x-axis and Hours in the y-axis.. The x-axis shows values from 2020-08-13 10:51:25.7143 to 2020-09-11 13:08:34.2857. The y-axis shows values from 7.525151619572689 to 222.63151504709398.