Edit chart
Loading graph
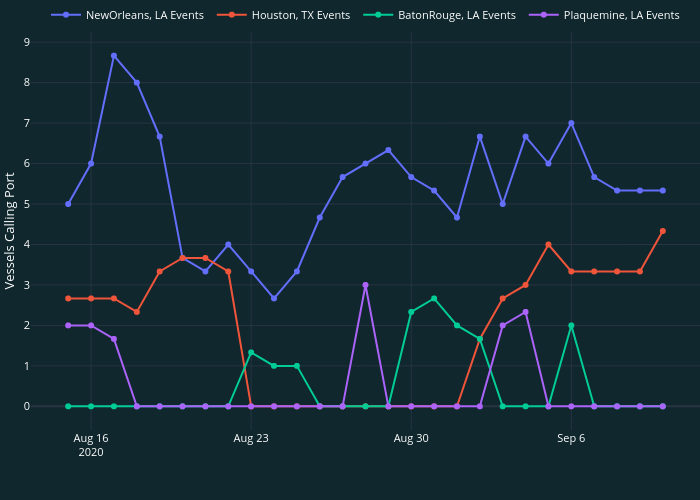
Simao.oliveira's interactive graph and data of "" is a line chart, showing NewOrleans, LA Events , Houston, TX Events , BatonRouge, LA Events , Plaquemine, LA Events; with in the x-axis and Vessels Calling Port in the y-axis.. The x-axis shows values from 2020-08-13 10:53:03.9503 to 2020-09-11 13:06:56.0497. The y-axis shows values from -0.5644383184011027 to 9.231104985067768.