Edit chart
Loading graph
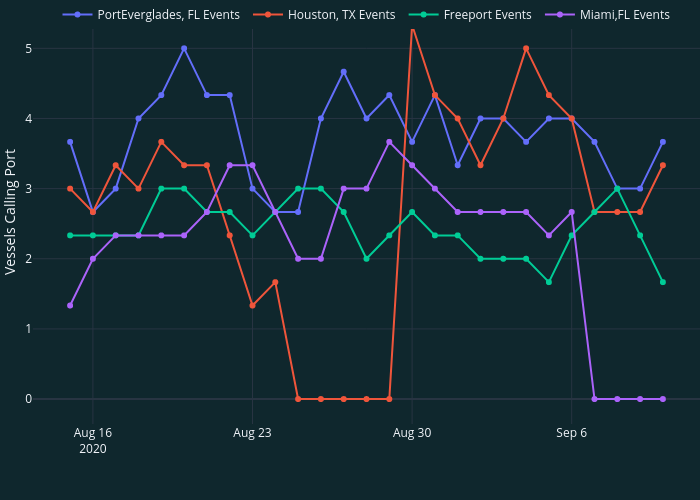
Simao.oliveira's interactive graph and data of "" is a line chart, showing PortEverglades, FL Events , Houston, TX Events , Freeport Events , Miami,FL Events; with in the x-axis and Vessels Calling Port in the y-axis.. The x-axis shows values from 2020-08-13 10:52:48.9782 to 2020-09-11 13:07:11.0218. The y-axis shows values from -0.34399370394219075 to 5.677327037275524.