Edit chart
Loading graph
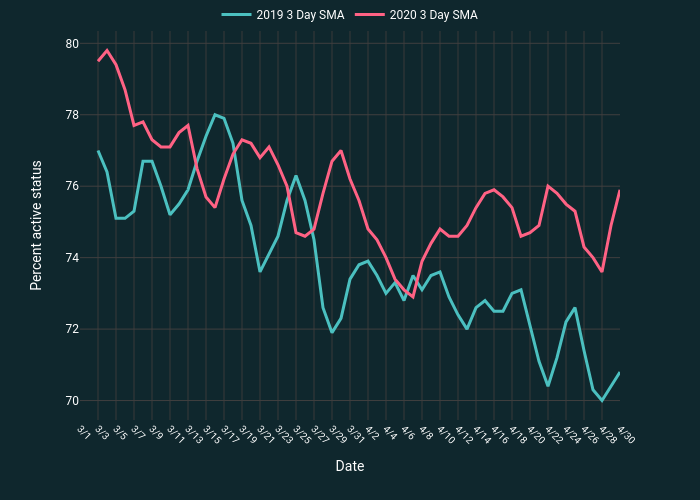
Simao.oliveira's interactive graph and data of "" is a line chart, showing 2019 3 Day SMA vs 2020 3 Day SMA; with Date in the x-axis and Percent active status in the y-axis.. The x-axis shows values from 0 to 60. The y-axis shows values from 69.45555555555555 to 80.34444444444445.