Edit chart
Loading graph
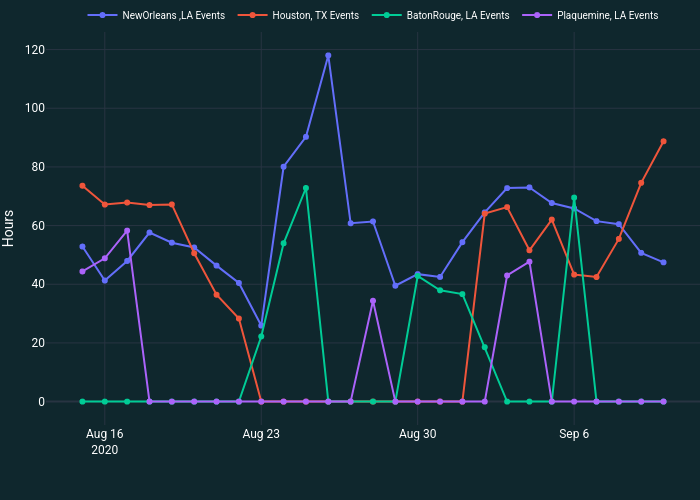
Simao.oliveira's interactive graph and data of "" is a line chart, showing NewOrleans ,LA Events , Houston, TX Events , BatonRouge, LA Events , Plaquemine, LA Events; with in the x-axis and Hours in the y-axis.. The x-axis shows values from 2020-08-13 10:51:10.4064 to 2020-09-11 13:08:49.5936. The y-axis shows values from -7.697712782420304 to 125.71104611575362.