Edit chart
Loading graph
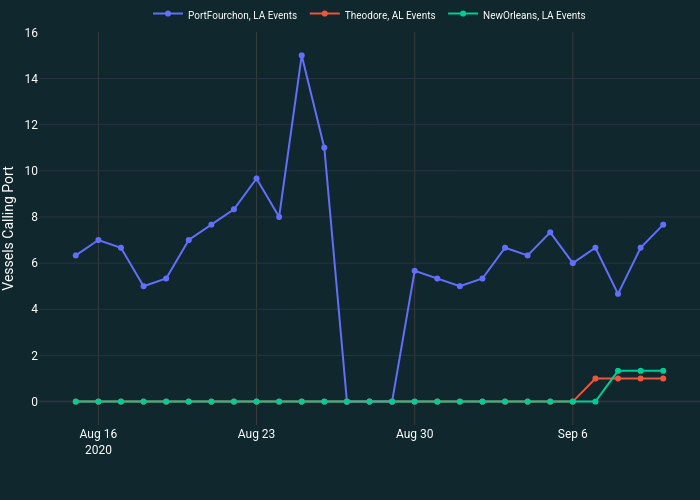
Simao.oliveira's interactive graph and data of "" is a , showing PortFourchon, LA Events , Theodore, AL Events , NewOrleans, LA Events; with in the x-axis and Vessels Calling Port in the y-axis.. The x-axis shows values from 2020-08-13 10:52:03.7553 to 2020-09-11 13:07:56.2447. The y-axis shows values from -0.9784122562674096 to 15.97841225626741.