Edit chart
Loading graph
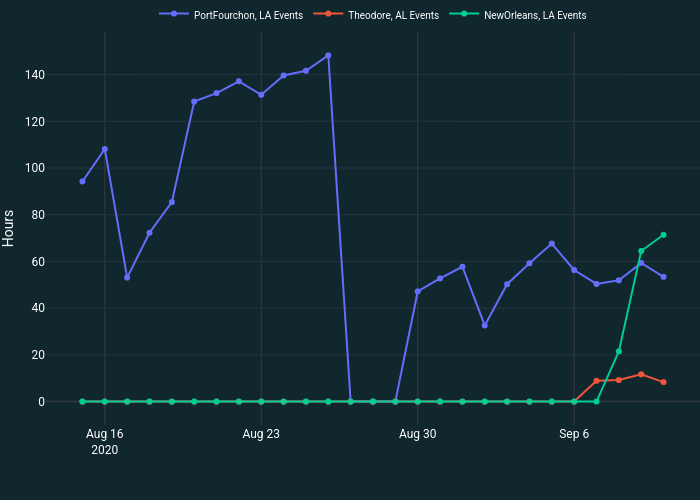
Simao.oliveira's interactive graph and data of "" is a , showing PortFourchon, LA Events, Theodore, AL Events, NewOrleans, LA Events; with in the x-axis and Hours in the y-axis.. The x-axis shows values from 2020-08-13 10:51:10.4064 to 2020-09-11 13:08:49.5936. The y-axis shows values from -9.66736536675953 to 157.8773653667597.