Edit chart
Loading graph
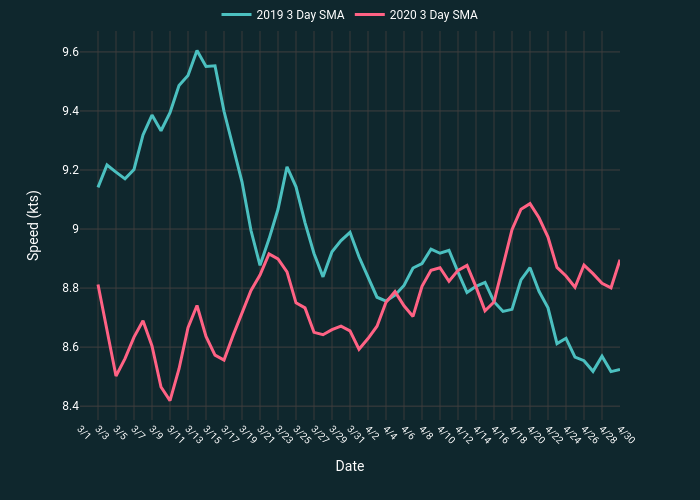
Simao.oliveira's interactive graph and data of "" is a line chart, showing 2019 3 Day SMA vs 2020 3 Day SMA; with Date in the x-axis and Speed (kts) in the y-axis.. The x-axis shows values from 0 to 60. The y-axis shows values from 8.353111111111112 to 9.67088888888889.