Edit chart
Loading graph
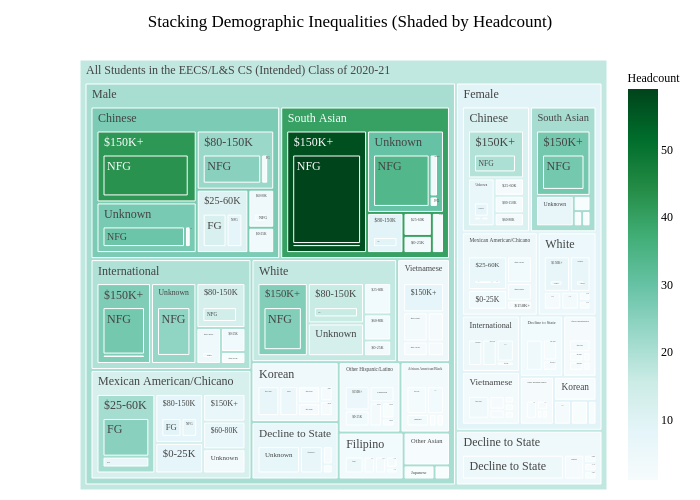
Shomil's interactive graph and data of "Stacking Demographic Inequalities (Shaded by Headcount)" is a treemap. The x-axis shows values from 0 to 0. The y-axis shows values from 0 to 0.