Edit chart
Loading graph
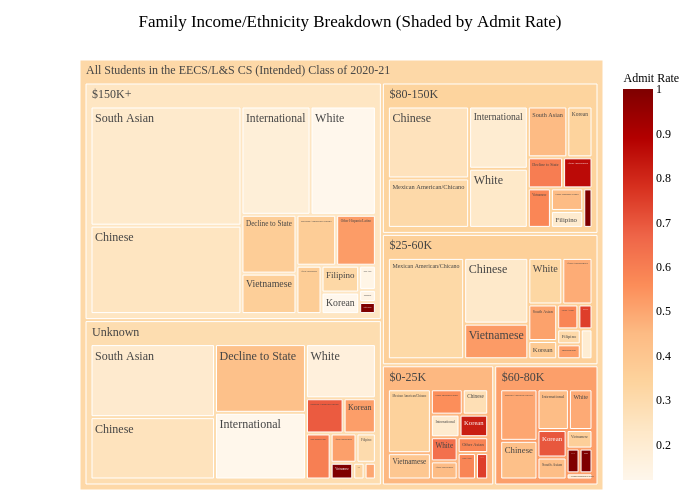
Shomil's interactive graph and data of "Family Income/Ethnicity Breakdown (Shaded by Admit Rate)" is a treemap. The x-axis shows values from 0 to 0. The y-axis shows values from 0 to 0.