Edit chart
Loading graph
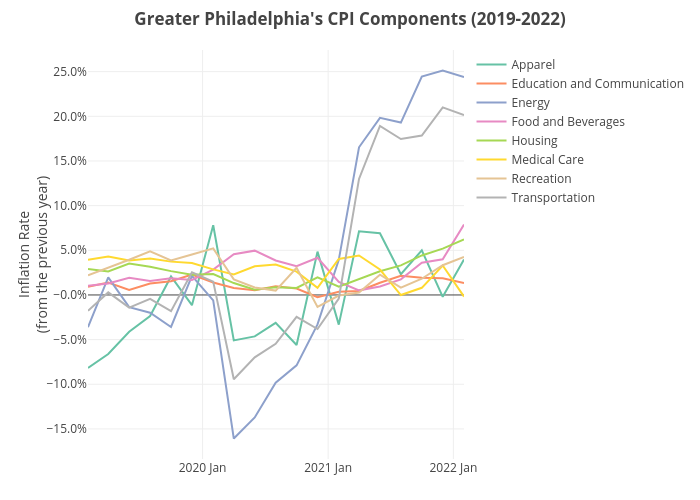
Shields.mi417's interactive graph and data of "Greater Philadelphia's CPI Components (2019-2022)" is a line chart, showing Apparel, Education and Communication, Energy, Food and Beverages, Housing, Medical Care, Recreation, Transportation; with Inflation Rate(from the previous year) in the y-axis. The x-axis shows values from 0 to 0. The y-axis shows values from 0 to 0.