Edit chart
Loading graph
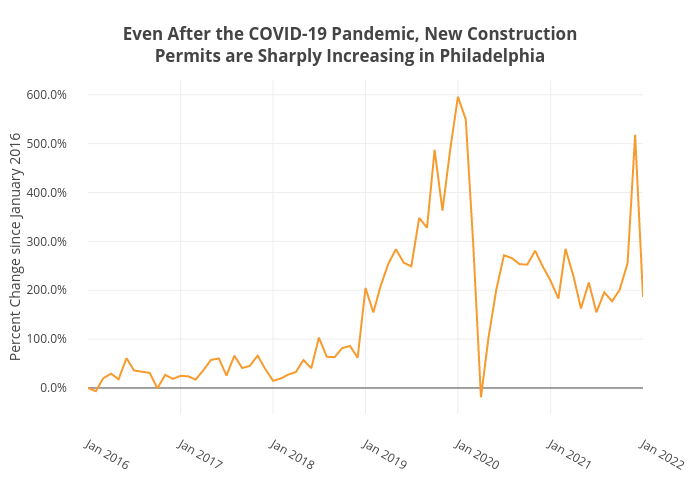
Shields.mi417's interactive graph and data of "Even After the COVID-19 Pandemic, New ConstructionPermits are Sharply Increasing in Philadelphia" is a line chart; with Percent Change since January 2016 in the y-axis. The x-axis shows values from 0 to 0. The y-axis shows values from 0 to 0.