Edit chart
Loading graph
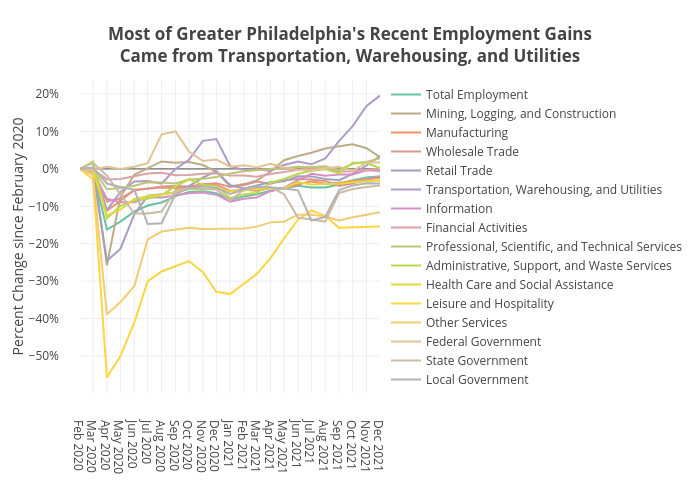
Shields.mi417's interactive graph and data of "Most of Greater Philadelphia's Recent Employment GainsCame from Transportation, Warehousing, and Utilities" is a line chart, showing Total Employment, Mining, Logging, and Construction, Manufacturing, Wholesale Trade, Retail Trade, Transportation, Warehousing, and Utilities, Information, Financial Activities, Professional, Scientific, and Technical Services, Administrative, Support, and Waste Services, Health Care and Social Assistance, Leisure and Hospitality, Other Services, Federal Government , State Government , Local Government; with Percent Change since February 2020 in the y-axis. The x-axis shows values from 0 to 0. The y-axis shows values from 0 to 0.