Edit chart
Loading graph
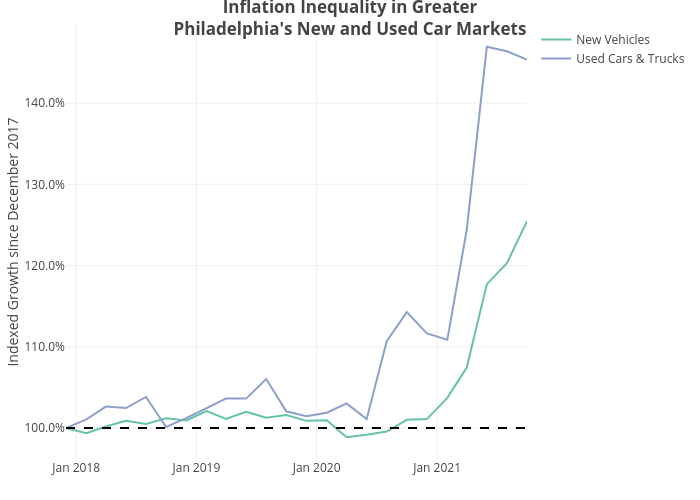
Shields.mi417's interactive graph and data of "Inflation Inequality in GreaterPhiladelphia's New and Used Car Markets" is a line chart, showing New Vehicles vs Used Cars & Trucks; with Indexed Growth since December 2017 in the y-axis. The x-axis shows values from 0 to 0. The y-axis shows values from 0 to 0.