Edit chart
Loading graph
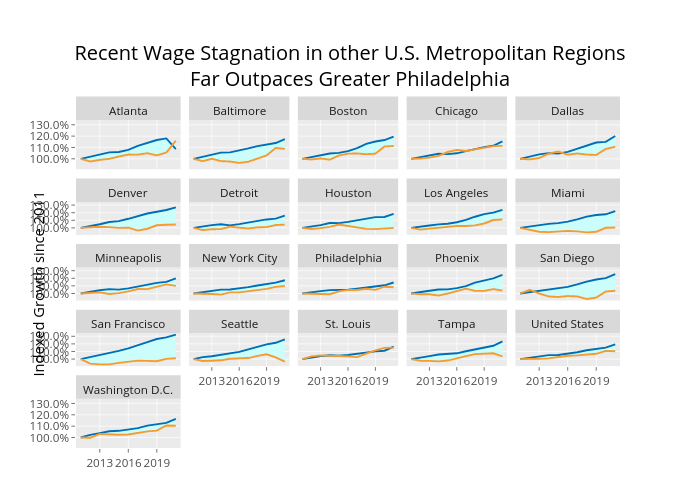
Shields.mi417's interactive graph and data of "Recent Wage Stagnation in other U.S. Metropolitan RegionsFar Outpaces Greater Philadelphia" is a filled line chart, showing (#CBFDFA,1), (#CBFDFA,2), (#CBFDFA,3), (#CBFDFA,4), (#CBFDFA,5), (#CBFDFA,6), (#CBFDFA,7), (#CBFDFA,8), (#CBFDFA,9), (#CBFDFA,10), (#CBFDFA,11), (#CBFDFA,12), (#CBFDFA,13), (#CBFDFA,14), (#CBFDFA,15), (#CBFDFA,16), (#CBFDFA,17), (#CBFDFA,18), (#CBFDFA,19), (#CBFDFA,20), (#CBFDFA,21). The x-axis shows values from 2010.5 to 2021.5. The y-axis shows values from 0.9073782637 to 1.3420846743. This visualization has the following annotations: Indexed Growth since 2011; Atlanta; Baltimore; Boston; Chicago; Dallas; Denver; Detroit; Houston; Los Angeles; Miami; Minneapolis; New York City; Philadelphia; Phoenix; San Diego; San Francisco; Seattle; St. Louis; Tampa; United States; Washington D.C.