Edit chart
Loading graph
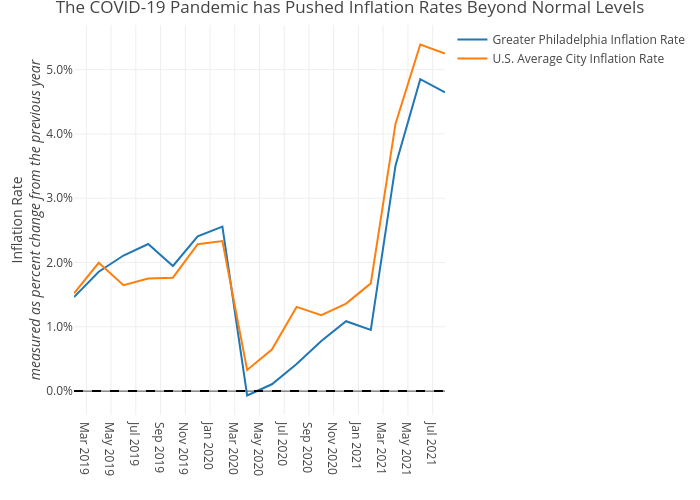
Shields.mi417's interactive graph and data of "The COVID-19 Pandemic has Pushed Inflation Rates Beyond Normal Levels" is a line chart, showing Greater Philadelphia Inflation Rate vs U.S. Average City Inflation Rate; with Inflation Ratemeasured as percent change from the previous year in the y-axis. The x-axis shows values from 0 to 0. The y-axis shows values from 0 to 0.