Edit chart
Loading graph
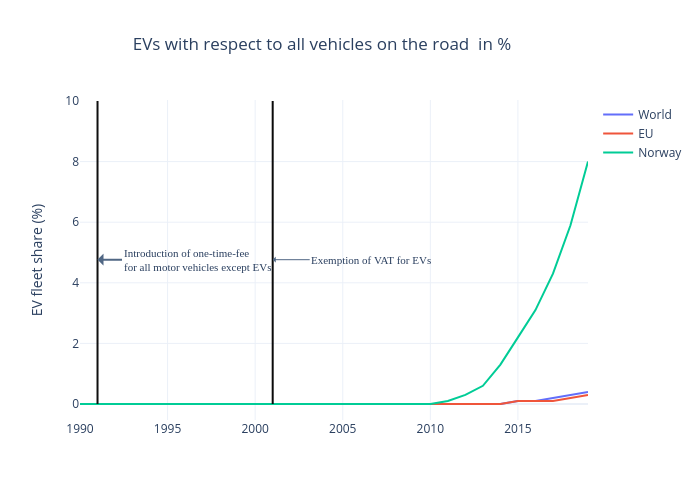
Shasha.jiang's interactive graph and data of "EVs with respect to all vehicles on the road in %" is a line chart, showing World , EU , Norway; with EV fleet share (%) in the y-axis. The x-axis shows values from 1990 to 2019. The y-axis shows values from -0.5291723202170964 to 10.054274084124831. This visualization has the following annotations: Introduction of one-time-fee for all motor vehicles except EVs; Exemption of VAT for EVs