Edit chart
Loading graph
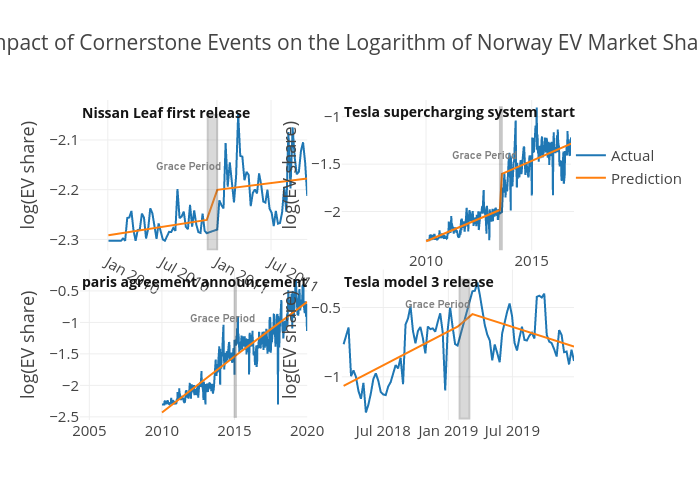
Shasha.jiang's interactive graph and data of "Impact of Cornerstone Events on the Logarithm of Norway EV Market Share" is a line chart, showing Actual vs Prediction; with time in the x-axis and log(EV share) in the y-axis.. The x-axis shows values from 2010-01-03 to 2011-10-30. The y-axis shows values from -2.3234374265423865 to -2.0083972839326325. This visualization has the following annotations: Nissan Leaf first release; Tesla supercharging system start; paris agreement announcement; Tesla model 3 release; Grace Period; Grace Period; Grace Period; Grace Period