Edit chart
Loading graph
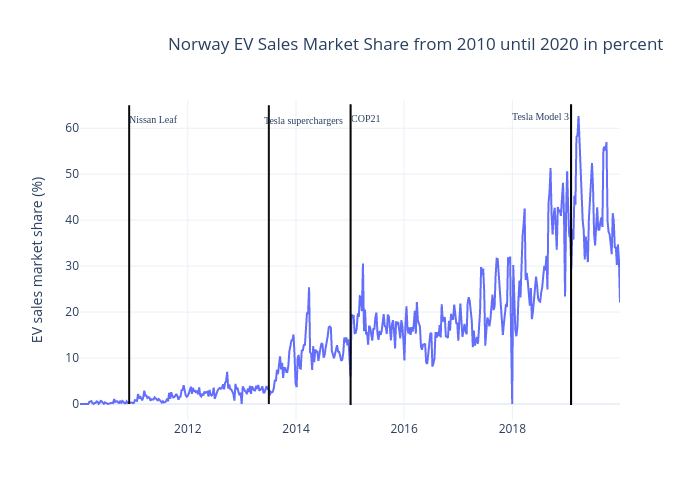
Shasha.jiang's interactive graph and data of "Norway EV Sales Market Share from 2010 until 2020 in percent" is a line chart; with time in the x-axis and EV sales market share (%) in the y-axis.. The x-axis shows values from 2010-01-03 to 2019-12-29. The y-axis shows values from -3.4810445666666667 to 66.13984676666666. This visualization has the following annotations: Tesla superchargers; Nissan Leaf; COP21; Tesla Model 3