Edit chart
Loading graph
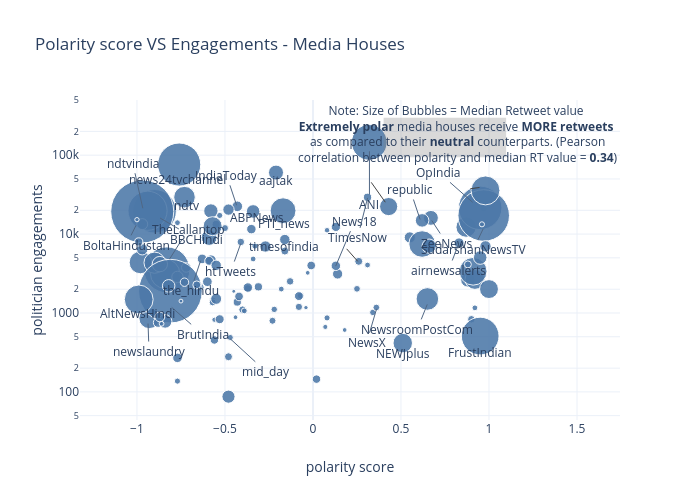
Shailyd's interactive graph and data of "Polarity score VS Engagements - Media Houses" is a scatter chart; with polarity score in the x-axis and politician engagements in the y-axis.. The x-axis shows values from -1.1599583521842483 to 1.1463617605754188. The y-axis shows values from 1.6987216275930122 to 5.491020159605906. This visualization has the following annotations: ZeeNews; ndtv; republic; PTI_news; OpIndia; ANI; aajtak; news24tvchannel; BrutIndia; BoltaHindustan; AltNewsHindi; newslaundry; TheLallantop; SudarshanNewsTV; FrustIndian; timesofindia; ndtvindia; BBCHindi; NewsX; ABPNews; IndiaToday; News18; the_hindu; htTweets; mid_day; NEWJplus; NewsroomPostCom; TimesNow; airnewsalerts; Note: Size of Bubbles = Median Retweet valueExtremely polar media houses receive MORE retweets as compared to their neutral counterparts. (Pearson correlation between polarity and median RT value = 0.34)