Edit chart
Loading graph
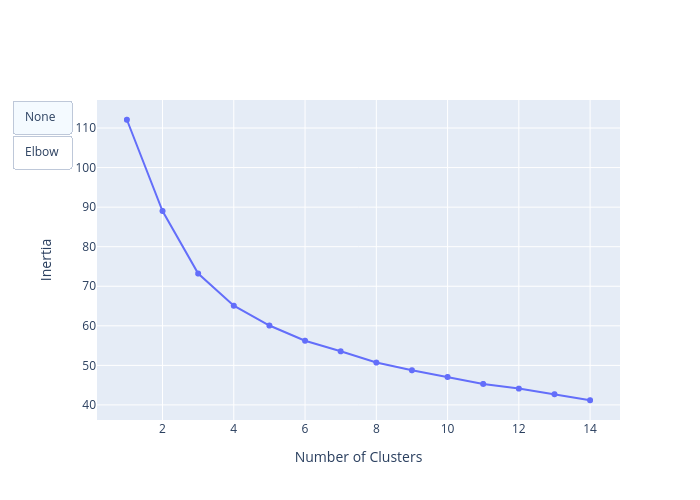
Shahv1057's interactive graph and data of "Inertia vs Number of Clusters" is a line chart; with Number of Clusters in the x-axis and Inertia in the y-axis.. The x-axis shows values from 0.1758841234010532 to 14.824115876598947. The y-axis shows values from 36.611565923257544 to 116.66758225208847.