Edit chart
Loading graph
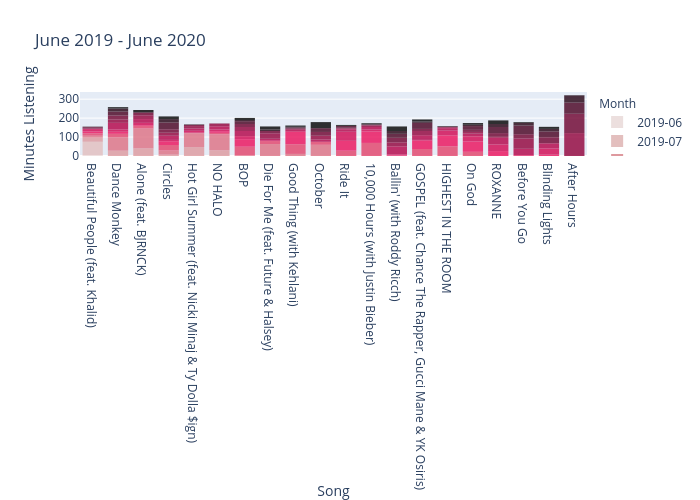
Shahv1057's interactive graph and data of "June 2019 - June 2020" is a , showing 2019-06, 2019-07, 2019-08, 2019-09, 2019-10, 2019-11, 2019-12, 2020-01, 2020-02, 2020-03, 2020-04, 2020-05, 2020-06; with Song in the x-axis and Minutes Listening in the y-axis.. The x-axis shows values from 0 to 0. The y-axis shows values from 0 to 0.