Edit chart
Loading graph
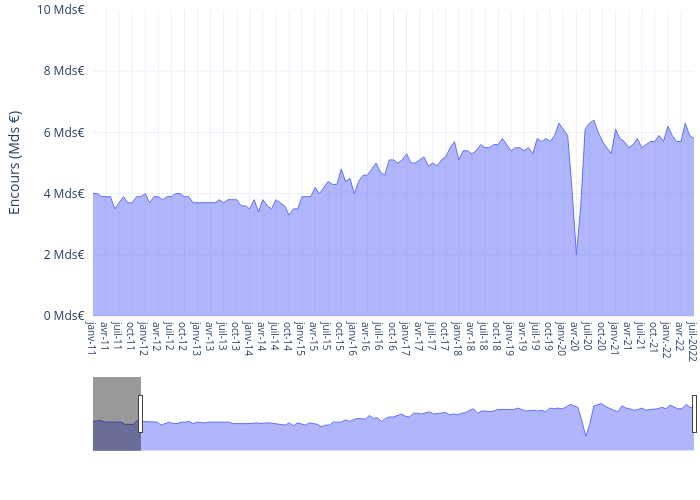
Sergiomonteiro's interactive graph and data of "Encours (Mds €) vs " is a filled line chart, showing %{meta.columnNames.y}; with in the x-axis and Encours (Mds €) in the y-axis.. The x-axis shows values from 138 to 0. The y-axis shows values from 0 to 10.