Edit chart
Loading graph
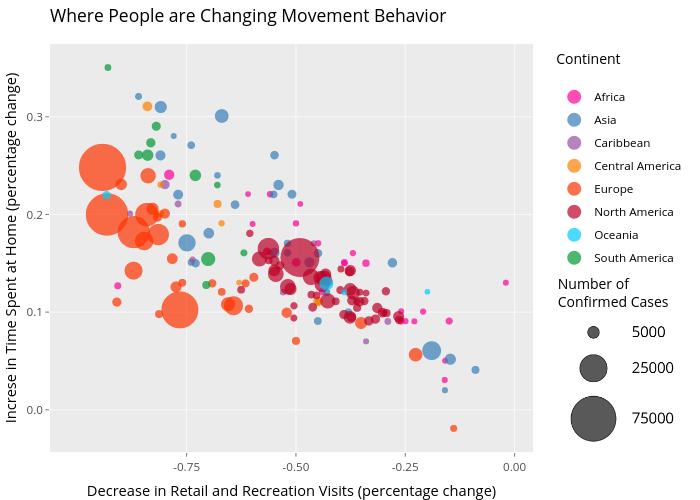
Seolhalee's interactive graph and data of "Where People are Changing Movement Behavior" is a scatter chart, showing Africa, Asia, Caribbean, Central America, Europe, North America, Oceania, South America; with Decrease in Retail and Recreation Visits (percentage change) in the x-axis and Increse in Time Spent at Home (percentage change) in the y-axis.. The x-axis shows values from -1.0317488757983437 to 0.037276772132976393. The y-axis shows values from -0.04295211554578218 to 0.37428538712140885. This visualization has the following annotation: Number of Confirmed Cases