Edit chart
Loading graph
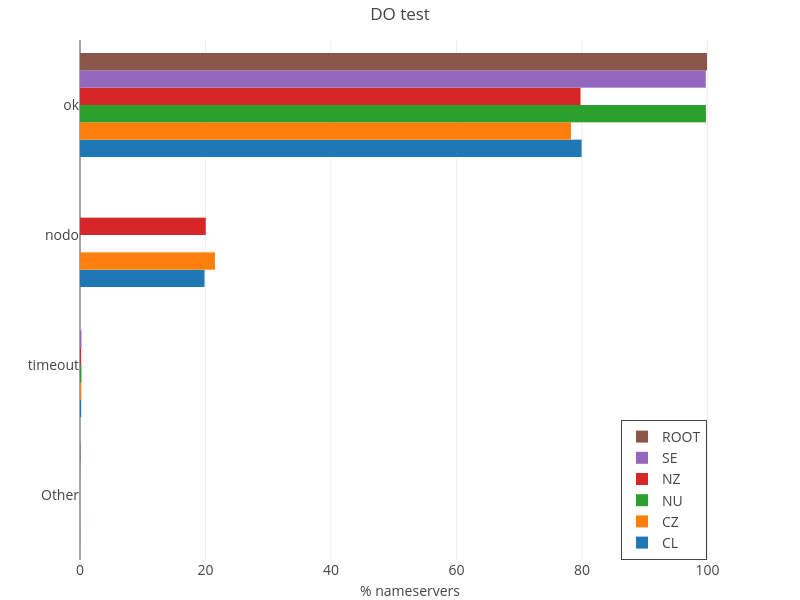
Secastro's interactive graph and data of "DO test" is a bar chart, showing CL, CZ, NU, NZ, SE, ROOT; with % nameservers in the x-axis. The x-axis shows values from 0 to 105.18695754873683. The y-axis shows values from -0.5 to 3.5.