Edit chart
Loading graph
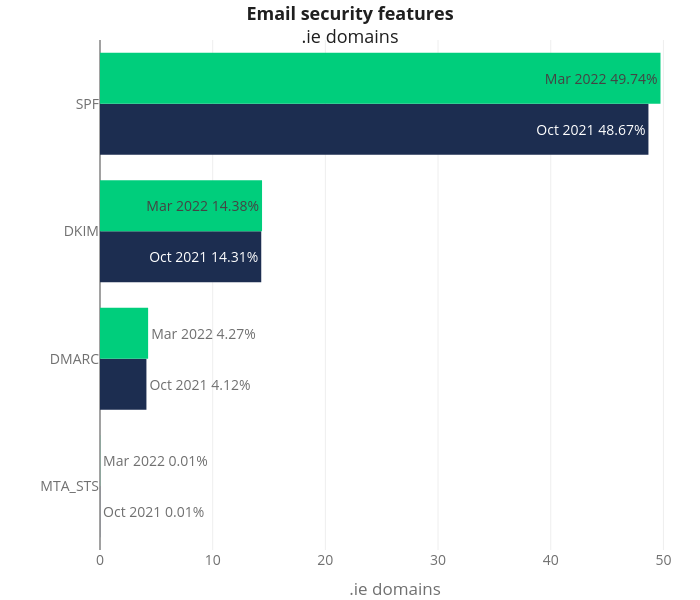
Sebcastro's interactive graph and data of "Email security features.ie domains" is a grouped bar chart, showing Oct 2021 vs Mar 2022; with .ie domains in the x-axis. The x-axis shows values from 0 to 0. The y-axis shows values from 0 to 0.